by Sundance at The Conservative Treehouse
The Bureau of Labor and Statistics (BLS) released the January inflation data [DATA HERE] along with the yearly data from 2021. The “first round” of retail grocery price increases starts to surface; but this is only the first round. January inflation was actually much worse than the bad data inside the BLS analysis.
Additionally, the BLS readjusted the weighting for relative price importance, putting added weight to urban economic priorities (ie. food at restaurants), which indicates their intent to downplay the scale of inflation overall. The topline statistic of 7.5% annual inflation (year over year) is bad; however, because of weighting that figure belies the bigger issue, it’s actually much worse. In January alone inflation jumped 0.8% (unadjusted), primarily driven by the first-round of 2022 consumer inflation that preexisted since early December 2021.
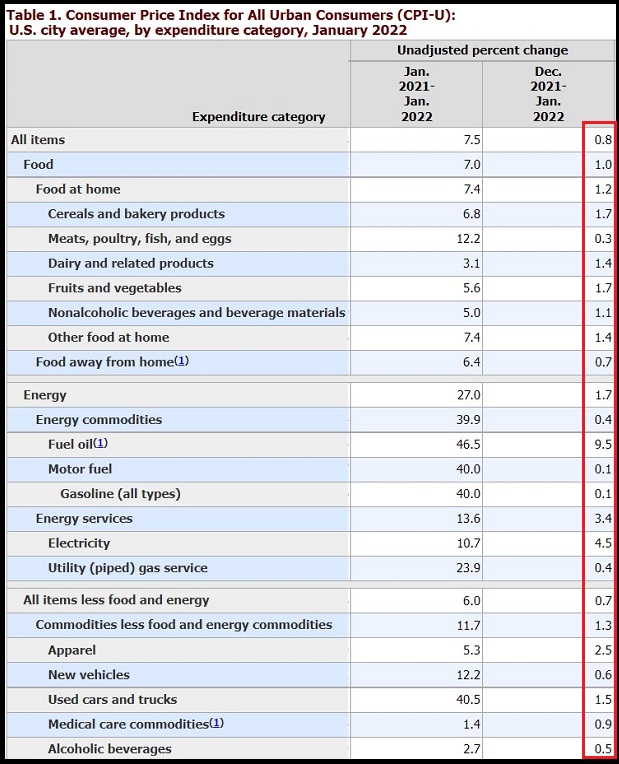 To give an idea of how much prices have increased, we modified BLS Table 1 to take out some noise. Look at the single month of January (red box).
Look at January “electricity” price increases. A jump of 4.5% in one month alone, and keep in mind the BLS puts far less importance on electricity than “food away from home”.
In fact, the weighting for economic importance of restaurants is 5 times greater than the electricity to power your house.
Always keep in mind inflation data is backward looking. So it is a capture of the price increase at a former moment. In this example the pricing survey was early January.
The timing part is important because gasoline has jumped again since this survey was completed. The BLS data only has gas increasing at 0.1% in January; in reality it increased much more.
You can see the statistical smoothing to present the softest inflation data by looking at Food at Home, Meats, Poultry and Fish. The actual rate of inflation in that category is 40%+ at retail. The BLS deemphasizes the price increase by putting less economic importance on the category and they come up with a 12.2% increase, one third of the actual price we are feeling.
Despite the BLS putting less emphasis on food we purchase to make at home, the overall scale of 7.5% aggregate weighted inflation would indicate to us that real inflation on all items is running around 23 to 28%.
Think about the inflation you are feeling at or near 20%, then compare that outcome to the 1970’s when we thought things were bad with 15% inflation.
On the positive side, well, actually just less bad side, some of the MSM is starting to realize the importance of looking at unavoidable inflation (food, fuel, energy) as the truer measure of the pain consumers are feeling…
Continue Reading