by David Stockman at Brownstone Institute
We are apparently back in the spend-your-way-to-prosperity mode. Last week Wall Street greeted the “strong” April PCE number with a spree of dip-buying, but you have to wonder just how long households can keep reaching into their cookie jars in order to spend what they are not earning.
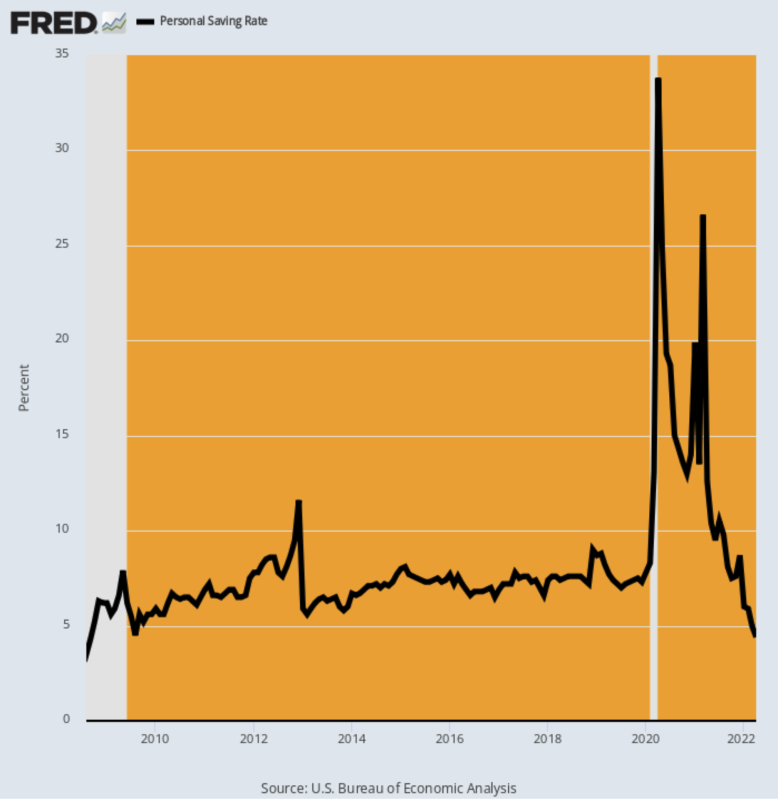
According to the Commerce Department, the abysmal 4.4% personal savings rate posted for April was the lowest level since August 2008, and we know what happened next!
Its also damn obvious from the chart that the triple whammy of the Covid-Lockdowns, the stimmy bacchanalia and red hot acceleration of global inflation and supply chain breakdowns has sent the standard economic numbers into a tailspin. After all, when the savings rate goes from an out-of-this-world 34% to a rock bottom 4% in just 24 months, you are not dealing with a standard economic cycle.
Instead, what you have is uncharted waters in every sense of the term. So more than ever, it is essential to pick through the statistical noise in order to identify the true fundamentals at work.
Personal Savings As A Percent Of Disposable Personal Income, August 2008-April 2022

For our money, that investigation starts with the obvious truth that when you are drawing-down your savings rate you are spending more than you earn. And since November 2020, that’s exactly what has been happening.
Household wages and salary compensation (purple line) is up by 14.8% in nominal terms but personal consumption expenditures have risen by 21% more. That is, April PCE (brown line) was 17.9% above what was already a Trump “stimmy” bloated level in November 2020.
