by Pam Martens and Russ Martens at Wall Street on Parade
On April 21 Josh Bivens posted a titillating analysis on the Working Economics Blog. Bivens has a Ph.D. in Economics from the New School for Social Research and is the Director of Research at the Economic Policy Institute. The blog post was titled: “Corporate profits have contributed disproportionately to inflation. How should policymakers respond?”
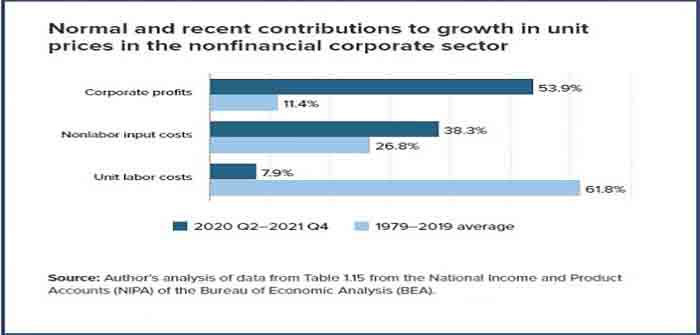
Included in the blog post was a graph showing that corporate profits account for 53.9 percent of the recent rise in inflation versus an average of 11.4 percent for the period 1979 through 2019. (See above chart.)
Bevins’ chart made it into the hands of Congresswoman Katie Porter, who blew it up into a giant poster and explained its significance during a hearing before the House Subcommittee on Economic and Consumer Policy on September 22. The hearing was titled: “Power and Profiteering: How Certain Industries Hiked Prices, Fleeced Consumers, and Drove Inflation.” Armed with the chart, Porter said this during the hearing: “This is another really important point when we talk about inflation – what consumers are experiencing. Prices are not going up just because of supply chain or labor or some other invisible market forces, they are going up because powerful executives are making deliberate choices to maximize their profits at the expense of the rest of us.”
The video clip of Porter went viral on Youtube; was picked up by the Jon Stewart podcast; featured on The View; and this week Katie Porter appeared in person on the MSNBC news program, All In with Chris Hayes, to discuss the chart further. (See video clip below.) The hearing witness that Porter is questioning in the video about the graph is Mike Konczal, the Director of Macroeconomic Analysis at the Roosevelt Institute. Konczal confirms that the data on the graph is accurate and provides his Institute’s own research on how corporations are using their market power to increase markups.
In his blog post, Bivens explores the rise in corporate power in an effort to understand how corporations are getting away with these unprecedented price increases. He writes:…
Continue Reading