by Tyler Durden at ZeroHedge
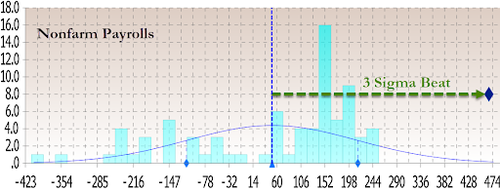
For those who only look at headlines, today’s payrolls report was a veritable shock: coming in at 467K, it was almost 4x the consensus median expectation of 125K, and was orders of magnitude above Goldman’s forecast of -250K. Putting the stunning, 3-sigma beat in context, it came above all 78 estimates, and was more than double the highest forecast of 225K from HSBC. Even more ludicrous were historical adjustments which saw December increased from 199K to 510K, November from 249K to 647K and so on.
How is that possible?
After all even CNBC – while interviewing labor secretary Marty Walsh – couldn’t believe the BLS data, prompting the secretary to repeat on many occasions that the numbers are “credible” and he “stands behind them” and of course he will: after all, taken at face value the numbers signal a resilient labor market and demand for workers despite omicron’s hit. The gains were broad-based, spanning retail, hospitality, transportation and warehousing, business services and others. In short, contrary to data from even the Atlanta Fed whose GDPNow shows Q1 GDP rising just 0.1%, the labor data indicates an economy firing on all cylinders and growing strong.
But is that true?
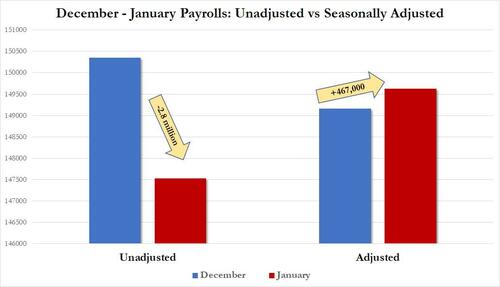
Well, here’s what happened. First, looking at just the December to January change we find that while the seasonally adjusted number rose by an impressive 467K, the unadjusted number collapsed, tumbling from 150.349 million to 147.525 million, a 2.8 million drop (as it tends to do every time the year shifts from December to January) meaning that the entire delta in the January number – somewhere in the 3+ million range – is due to arbitrary adjustments overlaid on top of the data.
The plot thickens, and indeed one thing that analysts apparently forgot when they were submitting their forecasts for January’s payrolls is that this is the month when the BLS adjusts data for the past 10 years as part of its population estimates revisions, which impact both the Household and more important, Establishment, surveys.
In summary, what these revisions did was to revise 2017 job growth lower by by -61,000, 2018 lower by -26,000, 2019 revised lower by -43,000, while 2020 was revised higher by 124,000, and 2021 was also revised up 217,000, or in total a 211,000 upward revision over 5 years or 3,500 jobs per month.
Focusing on just 2021…
Continue Reading

