by Steve Kirsch at Steve Kirsch’s Newsletter
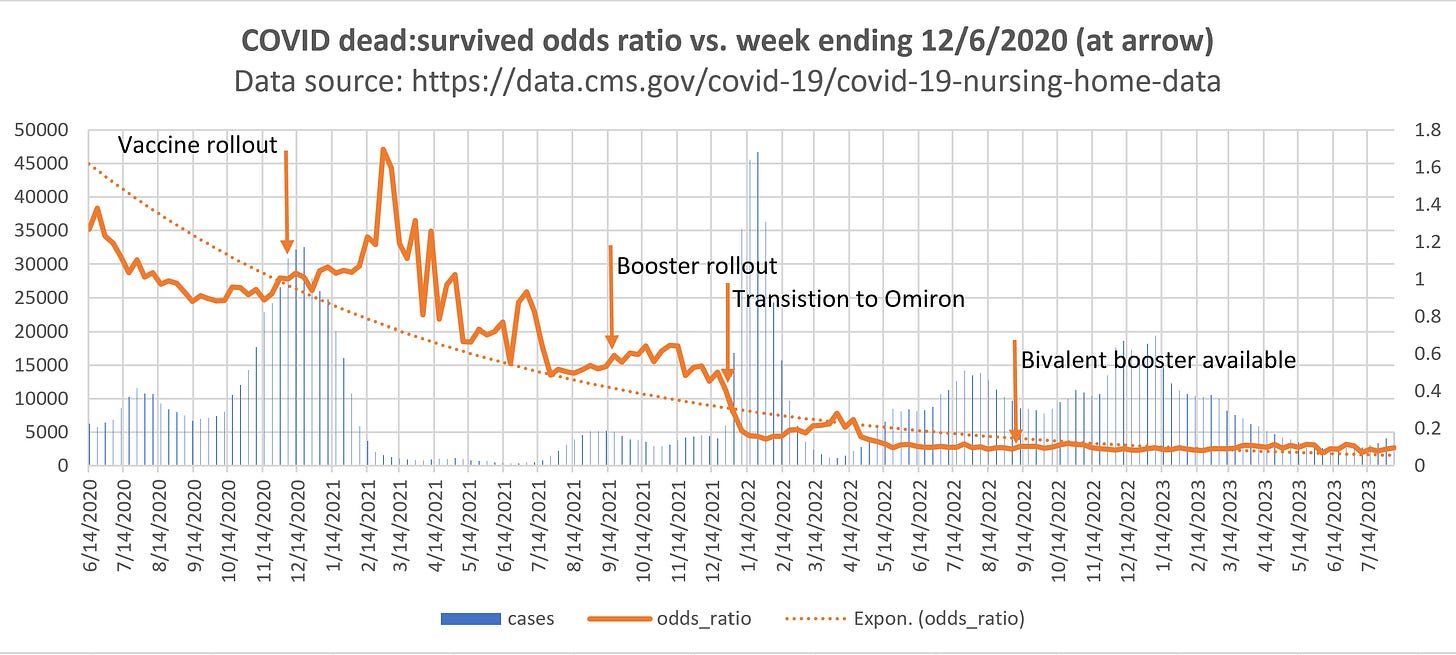
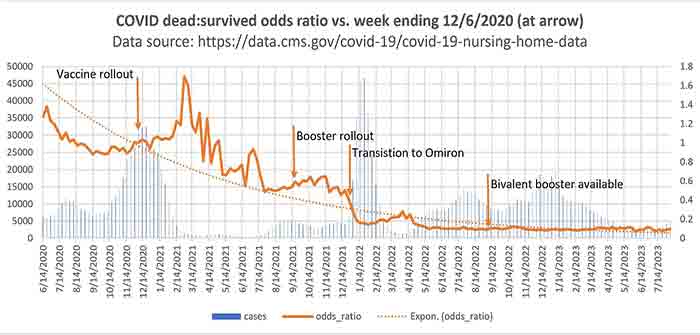
Figure 1. The US Nursing Home Data shows that the vaccines were a huge failure. The orange line represents the risk of dying from COVID. It’s an odds ratio relative to the odds on 12/6/20 which is the point right before the vaccines rolled out. The choice of the reference simply affects where OR=1 (the right hand legend). Any other point would show the exact same curve. As you can see, the odds ratio of dying (died from COVID:survived COVID infection) goes up from the trendline after the primary shots and after the booster shots. The only thing that did reduce death from COVID is when Omicron became the primary strain in late December 2021. The vaccines were a huge mistake because they significantly depressed people’s immune system. The blue bars are COVID cases just to show the risk of death is not related to cases going up or down. This was added to the chart to debunk Professor Morris’s claims that the IFR goes up when cases go down. Not true. As you can clearly see from this chart, the IFR spiked starting around 2/14/21, after cases had stabilized.
Executive summary
The signal from this data is clear and unambiguous: both the primary series and booster COVID vaccines increased the risk of death from COVID. The bivalent vaccines did absolutely nothing for the elderly (at least it didn’t make things worse, but it didn’t make things better).
The two things that reduced the infection fatality rate (IFR) were:
- Natural immunity (everyone had had COVID one or more times)
- The arrival of the much less deadly Omicron strain as the dominant strain in late December 2021
We can see both effects very clearly in the data shown in Figure 1 above.
This is why the CDC isn’t touting this database as proof that the vaccines work. Neither is anyone on the pro-vax side of the narrative despite the fact that this data has been in public view for 2 years now.
So since nobody from their side wanted to analyze the data, I thought it would be a good idea if someone from our side took a look.
The reason why they never wrote about this to prove their case is that it shows the opposite. The so-called “misinformation spreaders” have been right all along: the vaccine clearly significantly increased the risk of an elderly person getting COVID for around 4 months. This is a huge problem because this was the time when the vaccine was supposed to be most effective (since we now know from FOIA requests that the FDA knew that the vaccine protection waned after 4 months).
Health officials claimed the vaccine could reduce…
Continue Reading